
One naming layer.
Normalized commodities
Cucumber sizes, tomato varieties and origin codes are reconciled into one naming layer so the numbers actually compare.
Refreshed daily inside the app · snapshot on this page updated monthly.
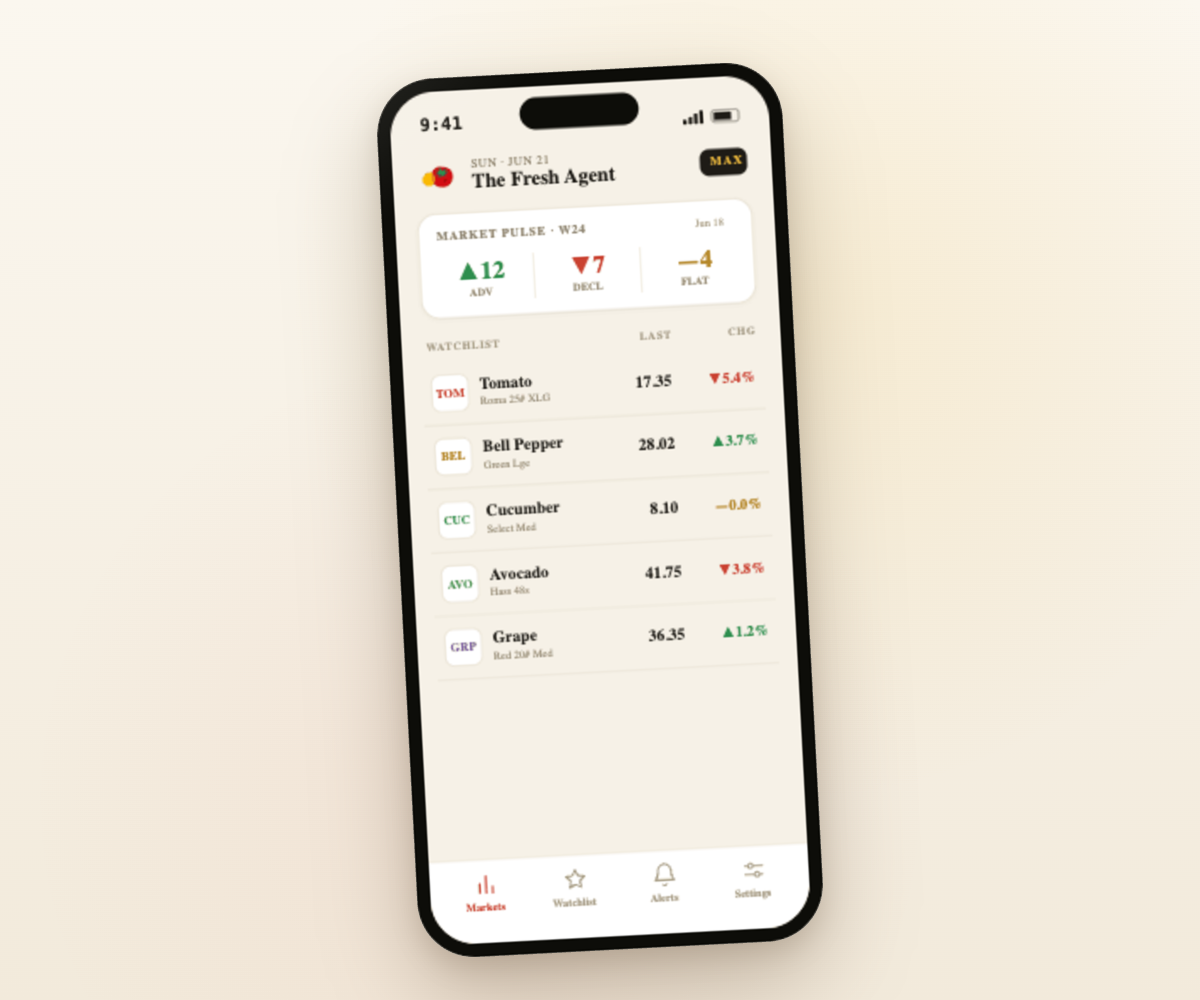
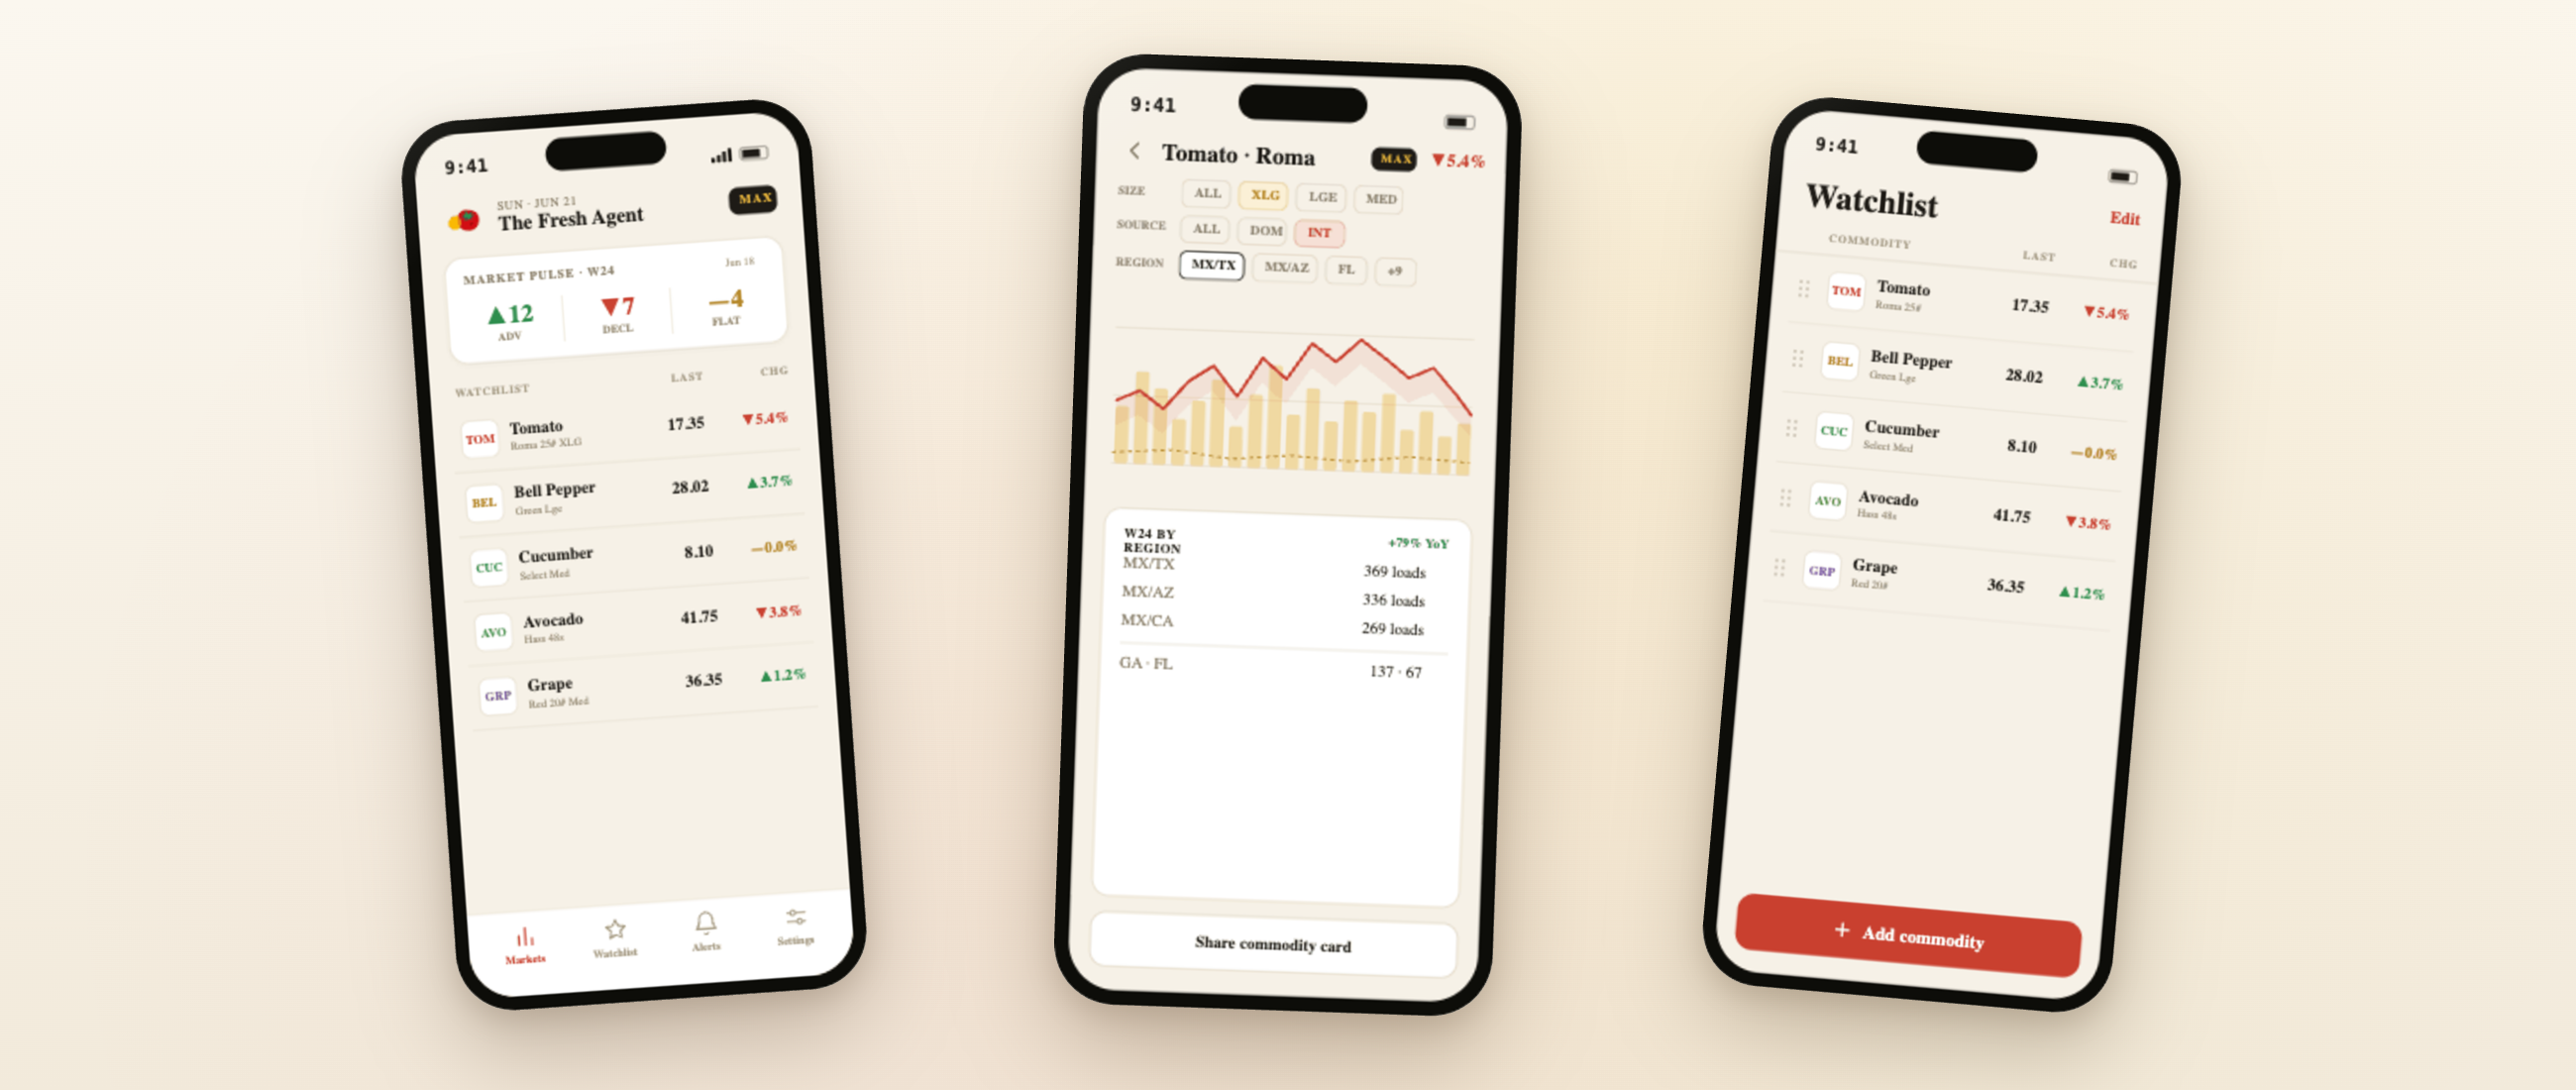
USDA pricing, movement, and trends for every commodity you trade — Free, or unlock it all with MAX. Cleaned, reconciled, and organized into a single terminal view, refreshed daily.
Source: USDA Market News · Refreshed daily

USDA publishes the numbers every market day. We turn them into something you can scan in seconds — normalized commodities, consistent varieties, year-over-year context, and district-level movement volume, all in one view.
One naming layer.
Cucumber sizes, tomato varieties and origin codes are reconciled into one naming layer so the numbers actually compare.
One terminal.
Every commodity, variety and pack style in one consistent layout — no more jumping between PDF reports.
One source.
Hover any day to see prior-year comparisons, district-level movement and the full trend line — not just today's number.
Thirty-four commodity groups and more than a hundred named varieties are pulled from USDA Market News, then normalized so a Roma tomato is a Roma tomato regardless of origin, pack style or district.
Every commodity page pairs the shipping-point price with movement volume and a multi-year trend line. Tooltips surface year-over-year comparisons on hover, so you can tell at a glance whether a print is a seasonal blip or a real break from history.
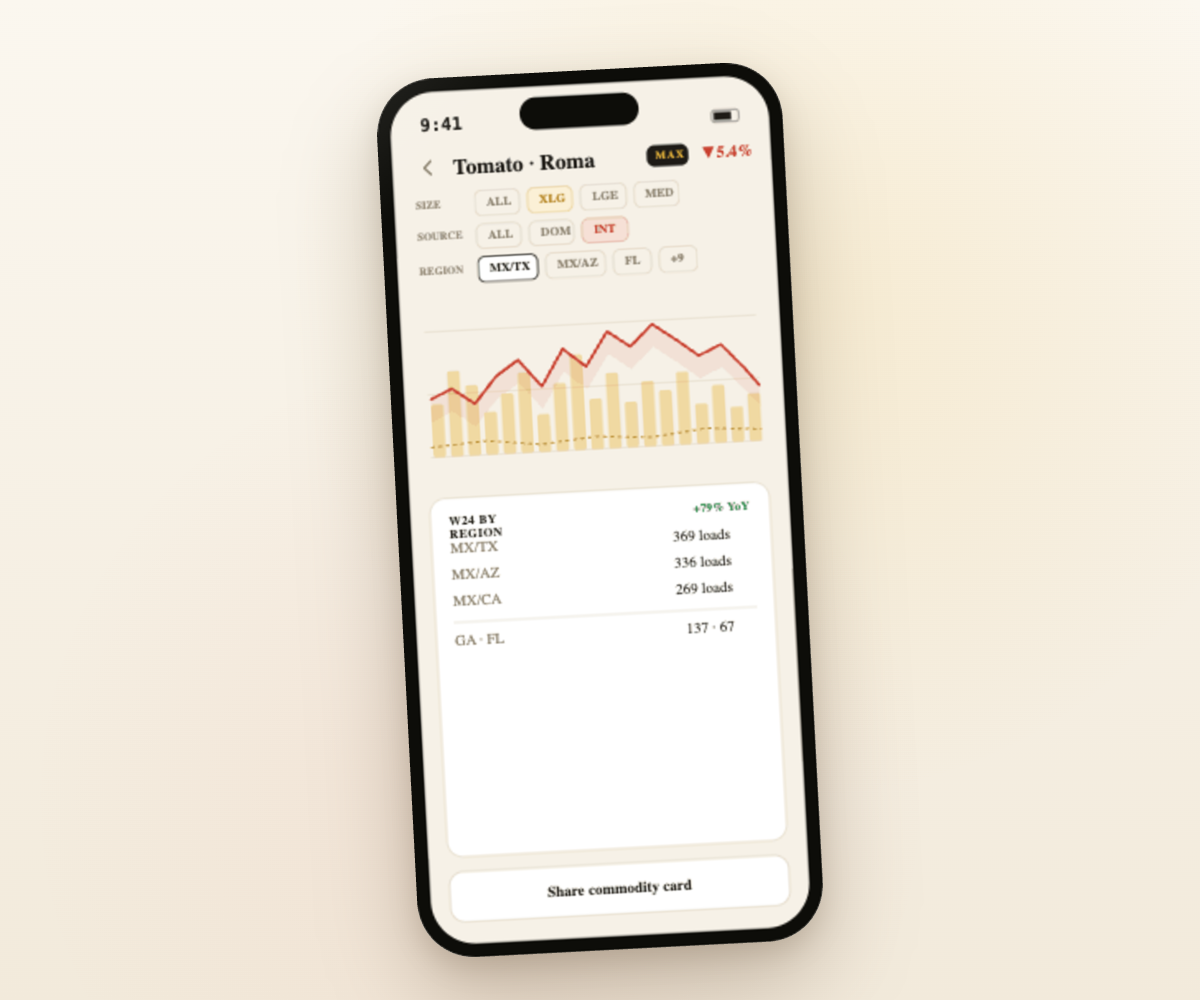
Every commodity carries a rolling multi-year history so you can see how the current week stacks up against the last three years at the same point in the calendar. Good for forecasting, budgeting, and sanity-checking a buyer who swears "it's never been this high."
The Fresh Agent is built on USDA Market News — the same public source the whole produce trade already reads. What we change is the shape. We take the public record, reconcile the commodities and varieties into a single naming layer, and organize the full coverage universe into one consistent terminal view, refreshed daily.
We don't invent prices, we don't curate a private panel, and we don't interpret the market for you. We take the public record and turn it into a terminal that respects your attention. If a number is on our dashboard, it came from a USDA Market News release you could go pull yourself — we've just saved you the hours of reading, reconciling and cross-referencing it usually takes to get there.
Start free with sample market data. Subscribe to MAX when you need full terminal access.
Nine commodity groups, free forever. No card required.
Full commodity coverage with the tools for running the full board.
See /pricing for the full plan comparison.
The Fresh Agent app is available now on the App Store and Google Play. Same data, same normalization, built for the times you need to check a print standing in front of a cooler instead of a desk.
Start free with sample data. Subscribe to MAX when you need the full terminal.